Unlocking the Power of Fixed Income
Episode 9
The Yield Curve – What It Tells Us About Market Expectations
Introduction
The yield curve is one of the most important indicators in fixed-income investing, offering insights into economic growth, inflation expectations, and future interest rate movements. By analyzing its shape, investors can anticipate market trends and position their portfolios accordingly.
In this episode, we’ll explore:
📌 What the yield curve is and how it works
📌 The three main types of yield curves: Normal, Flat, and Inverted
📌 What each yield curve signals about economic conditions and market sentiment
📌 How investors use the yield curve to optimize bond portfolio decisions
By the end, you’ll understand why the yield curve is a critical market signal and how to incorporate its insights into your investment strategy.
1. What Is the Yield Curve?
The yield curve is a graphical representation of bond yields across different maturities, typically for government bonds. It reflects investor expectations about interest rates, inflation, and economic cycles.
📌 Key Components of the Yield Curve:
✔ X-axis → Bond maturity (short-term to long-term)
✔ Y-axis → Yield (interest rate) of bonds at different maturities
📌 Why It Matters:
✔ Predicts economic trends – The yield curve often shifts before changes in economic conditions.
✔ Guides investment decisions – Helps investors determine whether short- or long-term bonds offer better value.
✔ Influences central bank policy – Policymakers monitor the yield curve for signs of inflation or recession.
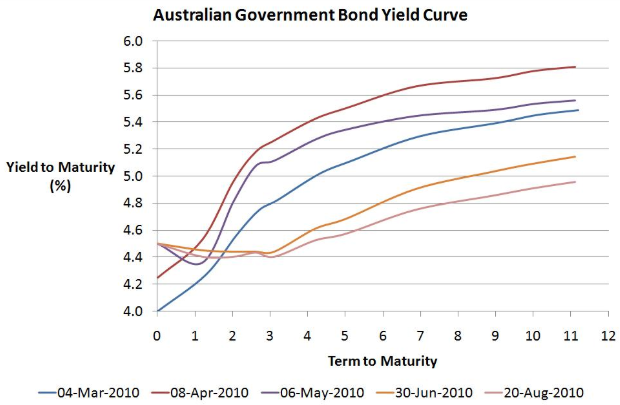
Figure 1 illustrates the Australian Government Bond Yield Curve at different points in 2010, showing how yields changed across various maturities. The curve is generally upward-sloping, indicating that longer-term bonds offered higher yields to compensate for inflation and uncertainty. Over time, the yield curve shifted, with March to May 2010 showing a steeper curve, reflecting expectations of economic growth and potential rate hikes. By August 2010, the curve flattened, suggesting concerns about slower growth or declining interest rate expectations. These shifts highlight how market sentiment, inflation outlook, and monetary policy influence bond yields, making the yield curve a critical tool for fixed-income investors.
2. The Three Types of Yield Curves
The yield curve isn’t static—it shifts based on economic conditions, inflation expectations, and central bank policies. Figure 1 below illustrates the three primary shapes:
Figure 1: Understanding Yield Curves – Normal, Flat, and Inverted
(Insert figure showing the three yield curve shapes: Normal, Flat, and Inverted)
1️⃣ Normal Yield Curve – Economic Expansion
✔ Definition: A normal (upward-sloping) yield curve occurs when long-term bonds have higher yields than short-term bonds.
✔ What It Signals: Strong economic growth, rising inflation, and expectations of higher future interest rates.
✔ Why It Happens: Investors demand higher yields for longer maturities due to greater risk and inflation uncertainty.
📌 Example:
Australia’s yield curve was normal in 2017-2018, reflecting stable growth and expectations of higher future rates.
💡 Investor Insight: A normal yield curve favors long-term bondholders who are compensated for taking on duration risk.
2️⃣ Flat Yield Curve – Economic Uncertainty
✔ Definition: A flat yield curve occurs when short- and long-term bonds have similar yields.
✔ What It Signals: Economic slowdown or transition in interest rate policy.
✔ Why It Happens: Markets anticipate rate changes, often during a shift from expansion to contraction.
📌 Example:
Australia’s yield curve flattened in 2019 when the RBA signaled a pause in rate hikes amid slowing global growth.
💡 Investor Insight: A flat yield curve suggests caution, and investors may consider diversifying with shorter-duration bonds to reduce interest rate risk.
3️⃣ Inverted Yield Curve – Recession Warning
✔ Definition: An inverted yield curve occurs when short-term bonds offer higher yields than long-term bonds.
✔ What It Signals: Recession risk and expected interest rate cuts.
✔ Why It Happens: Investors expect weaker growth and move into long-term bonds, pushing their yields lower.
📌 Example:
In 2022-2023, Australia’s yield curve inverted as markets anticipated RBA rate cuts amid rising inflation and economic slowdown.
💡 Investor Insight: An inverted yield curve signals a flight to safety—investors often increase exposure to cash, short-duration bonds, and defensive assets.
3. How Investors Use the Yield Curve
Smart investors monitor the yield curve to adjust bond allocations and interest rate strategies:
📌 Yield Curve Investment Strategies:
✔ Normal Yield Curve → Favor Long-Term Bonds
- When the yield curve is steep, long-term bonds provide higher yields, rewarding investors for locking in rates.
✔ Flat Yield Curve → Shorter Duration or Floating Rate Bonds
- When yields are similar across maturities, investors avoid long-term bonds to reduce interest rate risk.
✔ Inverted Yield Curve → Defensive Positioning
- In a recessionary environment, short-term bonds, cash, and high-quality assets offer protection against falling yields.
📌 Yield Curve & Economic Cycles:
| Yield Curve Type | Economic Outlook | Investor Strategy |
|---|---|---|
| Normal (Upward Sloping) | Economic growth, rising inflation | Hold long-term bonds, diversify with equities |
| Flat | Economic transition, uncertainty | Reduce duration, shift to short-term bonds |
| Inverted | Recession risk, lower interest rates ahead | Defensive positioning—cash, short-term bonds |
4. What’s Next for Australia’s Yield Curve?
The shape of Australia’s yield curve in 2024 will depend on RBA policy, inflation trends, and global economic conditions.
📌 Key Questions for Investors:
✔ Will the RBA keep raising rates, keeping the curve inverted?
✔ Could inflation cool down, leading to a steepening yield curve?
✔ How will global central banks impact Australia’s bond market?
💡 Final Thought:
The yield curve is a powerful forecasting tool. Investors should monitor its shifts to position their portfolios for changing economic conditions.
📌 Final Takeaways – Why Yield Curves Matter
✅ Normal Yield Curve → Indicates economic growth; long-term bonds offer higher yields.
✅ Flat Yield Curve → Suggests economic uncertainty; investors shorten duration.
✅ Inverted Yield Curve → Warns of recession; defensive positioning is key.
✅ Investors use yield curves to adjust bond allocations and interest rate exposure.
✅ Yield curves help forecast inflation, central bank policy, and economic cycles.
📌 Coming Up Next…
Next, we’ll explore "Bond Risk 101: Interest Rate Risk, Credit Risk, and Liquidity Risk," covering:
✔ How different risks impact bond investments
✔ Strategies to manage interest rate and credit risk
✔ Why liquidity matters in bond markets
🔔 Stay tuned for more fixed-income insights! 🚀📉